(
Note: this will be the first part in a continuing series)
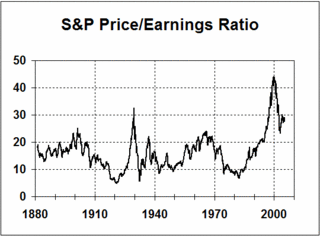
Below is a graph of S & P 500 Price to Earnings Ratio that I got from
www. generationaldynamics.com As you can see, price per earning hit a historic high during the bull run of the late 90's, and is currently still quite high. Some cry apocalypse.

In my mind, it's really the
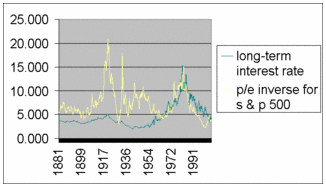
inverseof the p/e ratio that's important to study (i.e., the earnings per price ratio). This is because the inverse of p/e tells you what the return per dollar is based on current earnings, assuming no or even growth. The p/e inverse of stocks in general should correlate with the rate of return on any alternative forms of investment, such as real estate or bonds. Of course, because earnings growth is generally expected for stocks, the inverse of the p/e ratio will tend to be lower than long term interest rates, for which the return remains constant for the life of the investment.
Using statistics gathered from the S & P 500 and posted to the web by
Economist Robert Shiller, I graphed the inverse of the S & P 500 against the long term interest rates as tabulated by Mr. Shiller. Clearly, since about 1960, the inverse p/e has been very highly correlated to long-term interest rates. This is likely the result of increasingly conscious efforts by the central bank to control this relationship. I know this isn't anything new but the bottom line is this: the value of assets is dictated by the value of money, which is dictated by interest rates, which are controlled by the central bank. The more an investor can get from a safer investment (e..g, bonds), the less likely she will be to invest in a riskier asset with a higher possibility of return (the stocks). Stock prices will have to be lower for her to buy, and so the prices will come down, driving the e/p up, which is why the interest rates and the e/p of stocks move in tandem. Later we'll add median home values to the mix ...


